Markets
How China Overtook the U.S. as the World’s Major Trading Partner
How China Overtook the U.S. As the World’s Trade Partner
In 2018, trade accounted for 59% of global GDP, up nearly 1.5 times since 1980.
Over this timeframe, international trade has transformed significantly—not just in terms of volume and composition, but also in terms of the countries that the rest of the world leans on for their most important trade relationships.
Now, a critical shift is occurring in the landscape, and it may surprise you to learn that China has already usurped the U.S. as the world’s most dominant trading partner.
Trading Places: A Global Shift
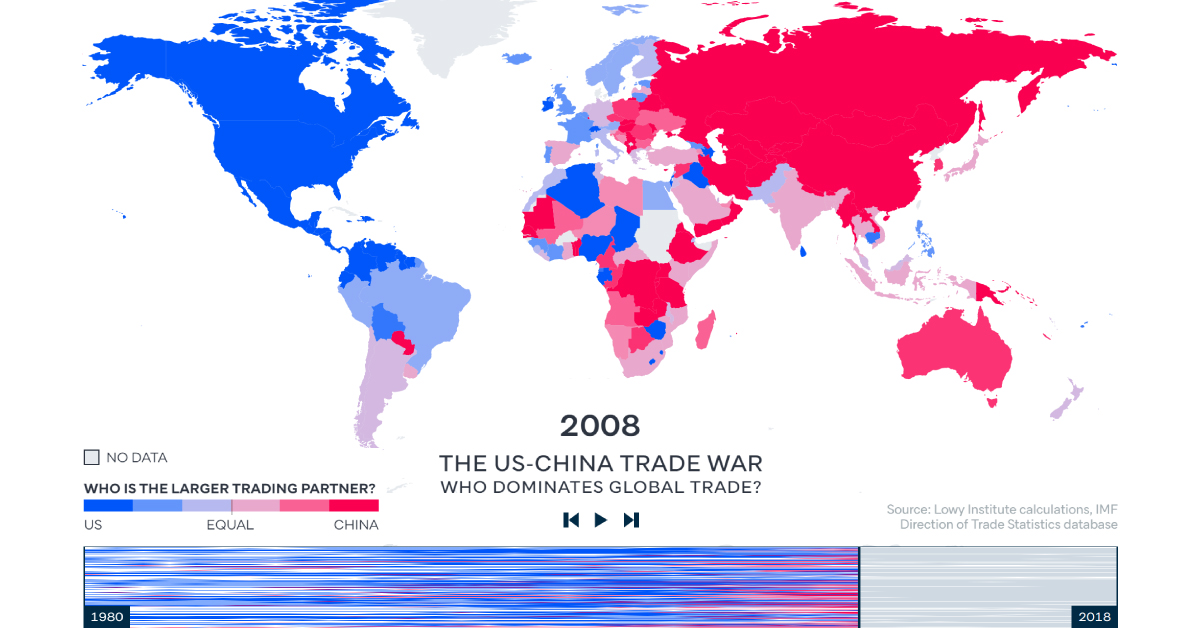
Today’s animation comes from the Lowy Institute, and it pulls data from the International Monetary Fund (IMF) database on bilateral trade flows, to determine whether the U.S. or China is a bigger trading partner for each country from 1980 to 2018.
The results are stark: before 2000, the U.S. was at the helm of global trade, as over 80% of countries traded with the U.S. more than they did with China. By 2018, that number had dropped sharply to just 30%, as China swiftly took top position in 128 of 190 countries.
The researchers pinpoint China’s 2001 entry into the World Trade Organization as a major turning point in China’s international trade relationships. The dramatic shift that followed is clearly demonstrated in the visualization above—between 2005 and 2010, a number of countries tipped towards Chinese influence, especially in Africa and Asia.
Over time, China’s dominance has grown dramatically. It’s no wonder then, that China and the U.S. have a contentious trade relationship themselves, as both nations battle it out for first place.
A Tale of Two Economies
The United States and China are competitors in many ways, but to be successful they must rely on each other for mutually beneficial trade. However, it’s also the major issue on which they are struggling to reach a common ground.
The U.S. has been vocal about negotiating more balanced trade agreements with China. In fact, a mid-2018 poll shows that 62% of Americans consider their trade relationship with China to be unfair.
Since 2018, both parties have faced a fraught relationship, imposing major tariffs on consumer and industrial goods—and retaliations are reaching greater and greater heights:
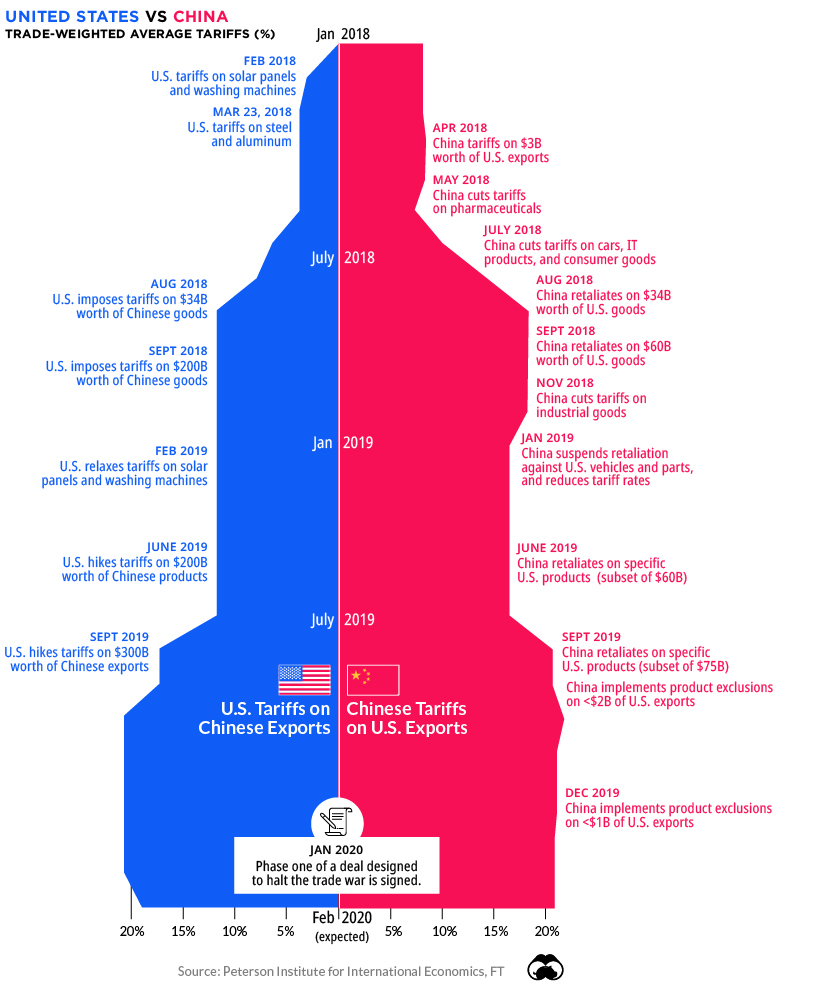
While a delicate truce has been reached at the moment, the trade war has caused a significant drag on global growth, and the World Bank estimates it will continue to have an effect into 2021.
At the same time, China’s sphere of influence continues to grow.
One Belt, One Road, One Trade Direction?
China seems to have a finger in every pie. The nation is financing a flurry of megaprojects across Asia and Africa—but one broader initiative stands above the rest.
China’s “One Belt, One Road” (OBOR) Initiative, planned for a 2049 completion, is advancing at a furious pace. In 2019 alone, Chinese companies signed contracts worth up to $128 billion to start Chinese large-scale infrastructure projects in various countries.
While building new highways and ports abroad is beneficial for Chinese financiers, OBOR is also about creating new markets and trade routes for Chinese goods in Asia. Recent research found that the OBOR program’s infrastructure expansion and logistics performance improvements led to positive effects on China’s exports.
Nevertheless, it’s clear the new infrastructure network is already transforming global trade, possibly cementing China’s position as the world’s major trading partner for years to come.


Markets
Visualizing Global Inflation Forecasts (2024-2026)
Here are IMF forecasts for global inflation rates up to 2026, highlighting a slow descent of price pressures amid resilient global growth.


Visualizing Global Inflation Forecasts (2024-2026)
Global inflation rates are gradually descending, but progress has been slow.
Today, the big question is if inflation will decline far enough to trigger easing monetary policy. So far, the Federal Reserve has held rates for nine months amid stronger than expected core inflation, which excludes volatile energy and food prices.
Yet looking further ahead, inflation forecasts from the International Monetary Fund (IMF) suggest that inflation will decline as price pressures ease, but the path of disinflation is not without its unknown risks.
This graphic shows global inflation forecasts, based on data from the April 2024 IMF World Economic Outlook.
Get the Key Insights of the IMF’s World Economic Outlook
Want a visual breakdown of the insights from the IMF’s 2024 World Economic Outlook report?
This visual is part of a special dispatch of the key takeaways exclusively for VC+ members.
Get the full dispatch of charts by signing up to VC+.
The IMF’s Inflation Outlook
Below, we show the IMF’s latest projections for global inflation rates through to 2026:
| Year | Global Inflation Rate (%) | Advanced Economies Inflation Rate (%) | Emerging Market and Developing Economies Inflation Rate (%) |
|---|---|---|---|
| 2019 | 3.5 | 1.4 | 5.1 |
| 2020 | 3.2 | 0.7 | 5.2 |
| 2021 | 4.7 | 3.1 | 5.9 |
| 2022 | 8.7 | 7.3 | 9.8 |
| 2023 | 6.8 | 4.6 | 8.3 |
| 2024 | 5.9 | 2.6 | 8.3 |
| 2025 | 4.5 | 2.0 | 6.2 |
| 2026 | 3.7 | 2.0 | 4.9 |
After hitting a peak of 8.7% in 2022, global inflation is projected to fall to 5.9% in 2024, reflecting promising inflation trends amid resilient global growth.
While inflation has largely declined due to falling energy and goods prices, persistently high services inflation poses challenges to mitigating price pressures. In addition, the IMF highlights the potential risk of an escalating conflict in the Middle East, which could lead to energy price shocks and higher shipping costs.
These developments could negatively affect inflation scenarios and prompt central banks to adopt tighter monetary policies. Overall, by 2026, global inflation is anticipated to decline to 3.7%—still notably above the 2% target set by several major economies.
Adding to this, we can see divergences in the path of inflation between advanced and emerging economies. While affluent nations are forecast to see inflation edge closer to the 2% target by 2026, emerging economies are projected to have inflation rates reach 4.9%—falling closer to their pre-pandemic averages.
Get the Full Analysis of the IMF’s Outlook on VC+
This visual is part of an exclusive special dispatch for VC+ members which breaks down the key takeaways from the IMF’s 2024 World Economic Outlook.
For the full set of charts and analysis, sign up for VC+.

-

 Misc6 days ago
Visualizing the Most Common Pets in the U.S.
-

 Culture2 weeks ago
The Highest Earning Athletes in Seven Professional Sports
-

 Science2 weeks ago
Visualizing the Average Lifespans of Mammals
-

 Brands2 weeks ago
How Tech Logos Have Evolved Over Time
-

 Energy2 weeks ago
Ranked: The Top 10 EV Battery Manufacturers in 2023
-

 Countries2 weeks ago
Countries With the Largest Happiness Gains Since 2010
-

 Economy2 weeks ago
VC+: Get Our Key Takeaways From the IMF’s World Economic Outlook
-

 Demographics1 week ago
The Countries That Have Become Sadder Since 2010